Statistical data presentation graphs
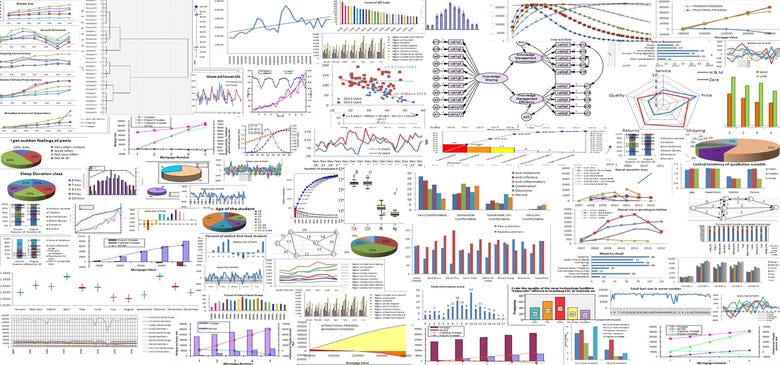
Different types of graphs are created for the statistical data analysis and presentation by using SPSS and Excel.

Su di me
I am 10 years experience in statistical, business and research data analysis by SPSS, AMOS, Minitab, STATA, JMP, Jamovi, JASP, Eviews, Gretl, LINGO and Excel computer software packages. I am engaged with research data analysis in Bangladesh Forest Research Institute and also engaged with teaching of Computer Data Analysis (business, statistical and econometric data) in Premier University. I have completed several data analysis projects, some of which are shown in my portfolio project. I think my knowledge, skills and experience will be helpful for your desired work. If you think so, don't hesitate to hire me. I am ready to develop new challenges by working on different types of data analysis with computer packages. This will help you by the best quality service and effective support for you or your organization.